 Cryptobubbles
Cryptobubbles lets you compare trading volume with market cap
Cryptobubbles displays market capitalization and 24-hour trading volume in sortable market views. Comparing these figures helps distinguish a large coin from one with heavy activity relative to its valuation. Market cap values the circulating supply at the current price. Volume measures reported trades during a defined period. Dividing daily volume by market cap gives a relative turnover measure when both figures use the same currency. A higher ratio describes more reported trading against that valuation. It does not establish cash inflows or the liquidity available for an order. Reading the values together also requires attention to price direction, market coverage, and measurement timing.
A rising volume-to-market-cap ratio can reflect a falling valuation even when reported trading volume remains unchanged.
Trading activity relative to the size of a coin
Volume and market cap describe different aspects of a coin, which explains why their rankings can differ substantially within the same market view. A large valuation does not require equally large daily trading activity. A smaller coin can have less absolute volume and a higher volume-to-market-cap ratio. The ratio addresses how much trading occurs relative to the value of circulating supply. Absolute volume answers how much reported value changes hands. Neither measure identifies the amount that every holder could receive by selling, because market cap applies a reference price across the circulating supply.
Displayed values and their comparison basis
The sortable list supports numerical comparisons by market cap and volume, while price performance supplies the direction that a turnover figure cannot express. These are separate measurements, even when the interface presents them together. Their labels determine what the numbers mean. A currency-valued volume total differs from a count of coins, and a price-change percentage differs from either measure. The comparison requires the same asset identity and compatible units.
| Displayed metric | Meaning of its value | Basis needed for comparison |
|---|---|---|
| Market capitalization | Current reference price multiplied by circulating supply | A circulating-supply figure and the chosen currency |
| 24-hour trading volume | Reported traded value during the preceding 24 hours | The same currency as market cap and comparable market coverage |
| Price performance | Percentage price change over the selected interval | A stated interval and consistent quote currency |
| Valuation, traded activity, and price direction describe separate aspects of the same coin. | ||
How do I calculate volume relative to market cap?
Divide a coin's reported 24-hour trading volume by its market capitalization, using values for the same coin in the same currency. The quotient expresses reported daily turnover relative to current valuation. Multiplying that quotient by 100 expresses it as a percentage.
An unavailable market cap leaves the ratio undefined; a zero denominator cannot support this calculation.
A higher quotient means greater reported turnover per unit of valuation within the comparison. It does not necessarily mean higher absolute trading volume. Comparing the ratio alongside the raw volume preserves both perspectives, while sorting only by volume answers the absolute-activity question. Rounding in the displayed inputs carries through to the quotient.
A falling valuation can lift the ratio
The ratio can increase even when reported trading volume stays unchanged, because a falling market cap reduces the denominator against which activity is measured. Market capitalization equals the current reference price multiplied by circulating supply. With circulating supply unchanged, a lower reference price reduces that valuation. Unchanged volume then represents a larger share of the smaller market cap. This arithmetic explains why a high turnover ratio can accompany falling prices. It does not demonstrate that new demand caused the increase, or that the coin has become easier to trade.
Current market cap describes a single valuation, which can differ from the average valuation throughout the trading window. Daily volume accumulates across transactions, while the denominator reflects a valuation at a particular moment. A sharp price move can therefore change the comparison before the older trades leave the volume window. The ratio alone does not separate these effects.
Does high trading volume mean a coin is rising?
High trading volume does not establish a rising price, because it records traded activity without describing the direction of the price change. Every matched trade has a buyer and a seller. The traded value alone does not establish which side drove the market price higher or lower. Price performance supplies that separate information for its stated interval. Active trading can accompany gains, losses, or little net price movement. Combining turnover with the relevant price change describes activity and direction together, without making volume a forecast of the next move.
Bubble settings affect the visual comparison
A bubble's size reflects its selected setting, so the visual impression of activity depends on whether that configuration emphasizes market cap, volume, or performance. A chart that sizes bubbles by valuation highlights relative market size. A volume setting emphasizes traded activity. The volume-to-market-cap calculation needs both numerical values. A size setting that represents just one of them does not express their quotient. Watchlists change the group under comparison, which can change how prominent a coin looks without altering the meaning of its volume figure. The selected timeframe gives price performance its interval; the 24-hour label gives daily volume its own measurement period.
Reported turnover and available liquidity describe different conditions
A high volume-to-market-cap ratio describes past trading activity, while available liquidity determines how much a particular market can absorb near its quoted price. Volume adds completed trades across its reporting window. An order book shows open buying and selling orders at different prices on a particular venue. Market depth describes their quantities across those price levels. A busy coin-wide market can therefore coexist with limited depth in the specific market where someone wants to trade.
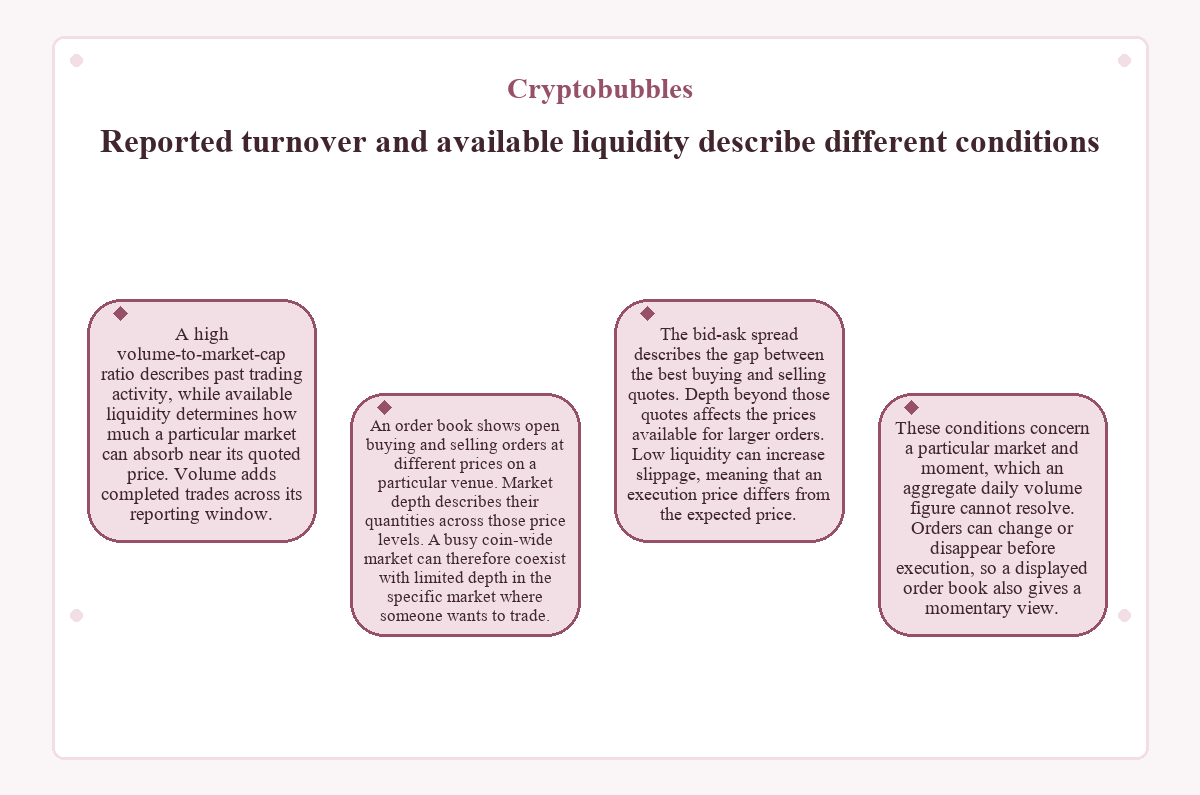
The bid-ask spread describes the gap between the best buying and selling quotes. Depth beyond those quotes affects the prices available for larger orders. Low liquidity can increase slippage, meaning that an execution price differs from the expected price. These conditions concern a particular market and moment, which an aggregate daily volume figure cannot resolve.
Orders can change or disappear before execution, so a displayed order book also gives a momentary view.
Market coverage shapes reported volume
A coin's reported volume depends on the markets included in the total and the rules that govern which reported trades qualify for inclusion. Coverage can span multiple venues and trading pairs. Different aggregation methods can exclude inconsistent data or markets with incentives that inflate activity. Wash trading creates an appearance of purchases and sales without the corresponding change in market position. This can inflate reported turnover without representing genuine market demand. A high figure alone does not establish whether an asset's reported activity reflects manipulation.
Spot trading volume and derivatives turnover describe different market activity. A total that covers traded coins differs from a figure that measures contracts. Shared currency units do not erase that distinction. Comparisons with figures elsewhere need matching definitions, including the reporting period and included markets. A change in coverage can change the total even when activity in previously covered markets stays unchanged.
Currency and timing constrain the comparison
Comparable ratios require matching currency units and observations that describe the same market snapshot as closely as the available data allows. Dividing volume in one currency by market cap in another leaves a conversion factor inside the answer. Converting both values with the same rate cancels that factor mathematically. Rounding, different conversion rates, or observations taken at different times can still produce differences. The selected display currency therefore matters to the inputs, even though a consistently converted ratio has no currency unit.
The 24-hour volume window covers recent trading; the market-cap denominator describes current valuation.
That combination measures recent turnover against current size. It does not measure an average trading day or establish how long heightened activity will continue. Comparing observations over time requires consistent units, coverage, and calculation basis. A single snapshot can describe relative activity at that moment, while a claim about a persistent change needs more than one observation.
Cryptobubbles: common questions
What does it mean if daily volume exceeds market cap?
Daily volume above market cap means reported traded value exceeds the current valuation of circulating supply during that reporting window. Coins can change hands repeatedly, so turnover can exceed the valuation. This does not mean every coin traded once, every holder sold, or an equal amount of new capital entered the market.
Is there a universal volume-to-market-cap ratio that identifies an undervalued coin?
A turnover ratio alone cannot establish that a coin is undervalued. It compares reported activity with current valuation, without measuring the project's future income, utility, or supply changes. Differences in market coverage and trading behavior also affect comparisons. A fixed threshold does not turn these displayed values into a valuation conclusion.
Can circulating supply change the ratio without extra trading?
A change in circulating supply can alter the ratio even if price and reported volume remain unchanged. More circulating supply raises market cap under those conditions and lowers the volume-to-market-cap ratio. A supply-estimate correction can also change the denominator. The revised ratio does not, by itself, show a change in trading activity.
Should fully diluted valuation replace market cap in this comparison?
Using fully diluted valuation creates a different comparison from volume divided by circulating market cap. Fully diluted valuation applies the current price to the supply assumed to be fully in circulation. It describes a theoretical valuation, which does not establish the price at which future supply will trade. Keep the denominator consistent when comparing coins.
Do wallet transfers count as the trading volume used in this comparison?
A wallet transfer does not automatically represent a trade that contributes to reported exchange volume. Moving coins between addresses can occur without a buyer, a seller, or an agreed trade price. Trading activity and on-chain transfer activity therefore measure different events. A transfer total cannot substitute for the displayed trading-volume figure.
Must a high turnover ratio involve many different traders?
A high volume-to-market-cap ratio does not reveal the number of distinct traders. The traded-value total can include repeated transactions involving the same participants. It therefore cannot establish how widely activity spreads across separate buyers and sellers. Participant counts require information beyond the market-cap and volume values.
Does sorting by volume reveal a project's revenue?
Sorting by trading volume does not rank project revenue. Volume measures traded value, while revenue depends on fees or other income that the project actually receives. Secondary-market trading can create turnover without transferring the traded amount to the project. The volume figure does not specify a revenue share or fee rate.
Are high ratios evidence that long-term holders are selling?
The ratio alone cannot identify whether long-term holders, recent buyers, or recurring market participants supplied the traded coins. Market cap and volume summarize valuation and trading activity without identifying the owners, holding periods, or individual transactions.
Last updated -